


 by Pierre Khawand, Founder and CEO
Swiss Psychiatrist Carl Jung distinguished between introverts and extroverts in 1921. Introverts, he theorized, focus primarily on their internal world and the meaning they make of the events around them. They also recharge their energy through solitude.
In contrast, extroverts are the opposite; they are drawn to the external life of socializing and they focus more on immersing themselves in activities and events. Extroverts regain their energy through their social interactions.
According to Susan Cain, author of the book Quiet: The Power of Introverts in a World That Can't Stop Talking (2012), introverts and extroverts differ on a variety of planes. For instance, introverts require less stimulation than extroverts to function well; they’re also less likely to multitask and make impulsive decisions in their work, are less comfortable with conflict than extroverts, and are more likely to identify as highly sensitive.
If you identify as primarily introverted, it’s a safe bet that you’re likely to feel (at least some of the time) overrun and overstimulated by the pace of your workplace, by the extroverts around you, and by the myriad of interruptions and happenings occurring throughout the day.
You may feel as though your mind is desperately seeking time to digest, recover, and recharge - continually fighting the current of a culture that’s largely idealizing extroversion.
On the other hand, if you identify as being an extrovert, you may be in a position of leadership: studies show 96% of managers report being extroverted. As such, you’re likely comfortable sharing your ideas and motivating your coworkers, but you run the risk of missing out on what quieter, more passive people have to share.

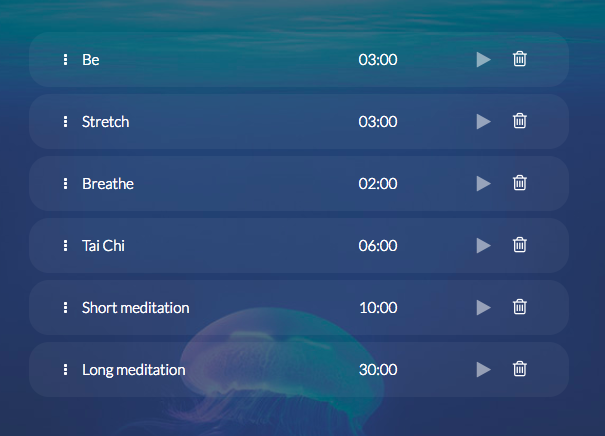
This is where the "Be" and "Be Silent" Breaks can help!
The “Be” Break is geared towards introverts. It consists of giving yourself a few minutes to “just be,” and nothing more. It’s a practice in “non-doing,” which means “letting things be and allowing them to unfold in their own way” according to Jon Kabat-Zinn. So let your mind wander, let thoughts and feelings surface, and give them all the space they need.
There’s no requirement to change anything, just try to observe what is going on inside you. When you’re ready to, you can begin to observe what is going on in the world around you. Notice your surroundings and the people nearby. Incorporating this meditation-like break several times a day can be calming and empowering. It allows you to recharge your batteries and feel more grounded amidst the distractions of your workday.
Now, as you may have guessed, the “Be Silent” Break targets extroverts. It consists of taking a break from being social, and instead to listen and observe what you may otherwise miss out on.
Start by paying attention to your surroundings and the people around you. Pay attention to their emotions, not just the words they’re saying. When you’re ready, direct your attention to the world inside. Check up on what’s going on in your mind, how you’re feeling, and any bodily sensations that arise.
What you’re accomplishing with these breaks, whether you’re an introvert or an extrovert, is a moment of mindfulness. “Mindfulness means paying attention in a particular way: on purpose, in the present moment, and nonjudgmentally,” says mindfulness pioneer and thought leader, Jon Kabat-Zinn.
Instead of going with the flow and being at the mercy of what’s happening around you, infusing mindfulness into your workday helps you stay afloat. It also reduces stress and emotional reactivity, while boosting memory and focus, according to the American Psychological Association.
Are you more of an introvert or extrovert? What kind of breaks do you enjoy the most? Will you try the “Be” and “Be Silent” Breaks? We would love to hear from you, please take our survey now by clicking here.
Article originally published on Thrive Global.


 “Is it really necessary to jot down in writing what I am working on now?” You might ask. “Aren’t we capable of remembering what we are working on? And aren’t we naturally aware of time?” To answer these questions,
 by Melissa Sweat, Customer Relationship & Community Manager


 Fourth, PDM encourages you to notice distracting thoughts and emotions by using the THOUGHT and EMOTION tags to label, rank, and move beyond them. MRI scans show that labeling emotions engages the higher order parts of the brain associated with thinking and planning; this indicates an awareness with less reactiveness to the emotion (remember, mindfulness is being aware without reacting). According to Chade-Meng Tan, author of Search Inside Yourself, How to Master Your Mind, and Joy on Demand, holding on - whether by refusing to let something go or by refusing to let something come - is what Buddhist meditators identify as the main cause of human suffering. Instead of holding on, PDM encourages you to welcome and transcend your thoughts and emotions, and, consequently, experience moments of happiness that quickly add up.
 Enough said! Mindfulness at work is needed and is achievable. It is the path to happiness and accomplishments and the best response yet to our work overload. PDM and the teachings of mindfulness thought leaders like Jon Kabat-Zinn, Dan Harris, Chade-Meng Tan, and the research of Dr. Eric Dane, the University of Washington, and the other thousands of individuals and organizations who have undertaken this topic are all here to guide us in undertaking this essential journey to happiness and accomplishment at work.